
1. Overview
Gatling is a mature and efficient performance testing tool that we can use to produce load against our REST application. But the only outcomes we can directly see from Gatling are whether the assertions were met and whether our server did not crash during the stress test.
The information we’re looking to get is more than that. Out of a performance test, we want to have JVM monitoring in place so we know if it functions and performs in the best possible way.
In this article, we’re going to set up some tools to help us monitor the application while the Gatling simulations are being executed. The setup will be on the container level, and we’ll use Docker Compose for local executions during the demonstrations. The tools we need to fully test and monitor the performance aspect are:
- A REST application that exposes metrics. Spring Boot Actuator can be used to get the metrics we need in this tutorial with no extra effort
- Prometheus will be the tool that collects the metrics from the REST application and stores them as time-series data
- InfluxDB, a time-series database, is used to gather metrics from Gatling
- Grafana, to visualize the results in nice graphs, lets us easily integrate with the data sources mentioned before, and we can also save our Grafana dashboards and reuse them
2. Set up the Monitoring Tools
To demonstrate how to achieve good monitoring, we’ll use containers and Docker Compose to spin up and orchestrate all tools. For each tool, we’ll need a Dockerfile with instructions for creating the container. Then, we’ll start all the services through Docker Compose. This will make the execution and communication between services easier.
2.1. REST API
Let’s start with the REST API that we’ll use to run the performance tests against. We’ll use a simple Spring Boot MVC Application with two endpoints. Because our focus is on monitoring performance tests, both endpoints are dummies. Just returning a simple OK response should be sufficient.
The reason we’ll have two endpoints is that one will immediately reply with 200, but the second one will have some random delays, for one to two seconds, before it returns a successful response:
@RestController
public class PerformanceTestsController {
    @GetMapping("/api/fast-response")
    public ResponseEntity<String> getFastResponse() {
        return ResponseEntity.ok("was that fast enough?");
    }
    @GetMapping("/api/slow-response")
    public ResponseEntity<String> getSlowResponse() throws InterruptedException {
        int min = 1000;
        int max = 2000;
        TimeUnit.MILLISECONDS.sleep(ThreadLocalRandom.current()
            .nextInt(min, max));
        return ResponseEntity.ok("this took a while");
    }
}
Then, we need to containerize the service by creating its Dockerfile:
FROM openjdk:17-jdk-slim
COPY target/gatling-java.jar app.jar
ENTRYPOINT ["java","-jar","/app.jar"]
EXPOSE 8080
First, we select the base image we need, which in this case is a Java 17 image. Then, we copy the artifacts we need to spin up the server. All we need is the Spring Boot Application JAR file we created, and then set it as the ENTRYPOINT of the container. Last, we mention the port (8080) that needs to be exported as the access point of the container.
2.2. Prometheus
All we need to do to create the Prometheus container is to find the base image of the Prometheus version we want to use. Then, we configure the targets we want to scrape for metrics.
Let’s define the configuration for the targets in a configuration.yml file:
global:
  scrape_interval:     15s
  evaluation_interval: 15s
scrape_configs:
  - job_name: 'prometheus'
    static_configs:
      - targets: ['localhost:9090']
  - job_name: 'grafana'
    scrape_interval: 5s
    metrics_path: /metrics
    static_configs:
      - targets: ['grafana:3000']
  - job_name: 'service_metrics'
    scrape_interval: 5s
    metrics_path: /private/metrics
    static_configs:
      - targets: ['service:8080']
First, we set the scrape and evaluation intervals to 15s to get more frequent and accurate data. Note that in a real-life environment, this frequency might cause unnecessary noise. The default value is usually 30 seconds.
In the scrape_configs, we add three jobs:
- prometheus will be scraping data from the Prometheus instance, from localhost, to monitor if Prometheus was healthy during the performance test executions. We include this because unhealthy monitoring tools might lead to inaccurate results.
- grafana points to the grafana service. All we need to do is set the host and path. The host is grafana:3000 and will only work when running the services through Docker Compose. The path is /metrics for the Grafana service by default.
- service_metrics will read metrics from our Spring Boot Application. Similar to grafana, we set the host to service:8080 for Docker Compose executions, and the path is defined through Spring Boot Actuator configuration.
Once we have the configuration.yml file in place, we need to define the Dockerfile:
FROM prom/prometheus:v2.48.1
COPY config/prometheus-docker.yml /etc/prometheus/prometheus.yml
EXPOSE 9090:9090
We start by choosing the Prometheus image version we’d like to use. Then, we copy and override the configuration that Prometheus expects to find in /etc/prometheus/prometheus.yml. Last, we mention the port (9090) that needs to be exported as the access point of the container.
2.3. Gatling
To run performance tests against the two endpoints we’ve created, we need to create a Gatling simulation that produces the load and the duration we want, to test our service. For better demonstration, we’ll have two Gatling simulations, one for the first endpoint and one for the second one:
public class SlowEndpointSimulation extends Simulation {
    public SlowEndpointSimulation() {
        ChainBuilder getSlowEndpointChainBuilder
          = SimulationUtils.simpleGetRequest("request_slow_endpoint", "/api/slow-response", 200);
        PopulationBuilder slowResponsesPopulationBuilder
          = SimulationUtils.buildScenario("getSlowResponses", getSlowEndpointChainBuilder, 120, 30, 300);
        setUp(slowResponsesPopulationBuilder)
          .assertions(
            details("request_slow_endpoint").successfulRequests().percent().gt(95.00),
            details("request_slow_endpoint").responseTime().max().lte(10000)
          );
    }
}
The SlowEndpointSimulation sets up a simulation with the name request_slow_endpoint, against the /api/slow-response path. The load will be 120 requests per second at peak, for 300 seconds and we assert that 95% of the responses should be successful and the response times should be less than 10s.
Similarly, we define the simulation for the second endpoint:
public class FastEndpointSimulation extends Simulation {
    public FastEndpointSimulation() {
        ChainBuilder getFastEndpointChainBuilder
          = SimulationUtils.simpleGetRequest("request_fast_endpoint", "/api/fast-response", 200);
        PopulationBuilder fastResponsesPopulationBuilder
          = SimulationUtils.buildScenario("getFastResponses", getFastEndpointChainBuilder, 200, 30, 180);
        setUp(fastResponsesPopulationBuilder)
          .assertions(
            details("request_fast_endpoint").successfulRequests().percent().gt(95.00),
            details("request_fast_endpoint").responseTime().max().lte(10000)
          );
    }
}
The FastEndpointSimulation class does the same as SlowEndpointSimulation, with a different name, request_fast_endpoint, and against the /api/fast-response path. We set the transactions in this one to 200 per second, to better stress the application, for 180 seconds.
For Gatling to export metrics that can be monitored and stored from Grafana, we need to configure Gatling to expose them to Graphite. The data will point to the InfluxDB instance, which will store the data. Last, Grafana will read from InfluxDB, as its data source, the metrics exposed by Gatling, and we’ll be able to create nice graphs to visualize it.
Enabling the exposure of metrics to Graphite, we need to add the configuration in gatling.conf file:
data {
  writers = [console, file, graphite]
  console {
  }
  file {
  }
  leak {
  }
  graphite {
    light = false
    host = "localhost"
    port = 2003
    protocol = "tcp"
    rootPathPrefix = "gatling"
    bufferSize = 8192
    writePeriod = 1
  }
}
We added the extra graphite writer and set the needed configuration. The host is localhost since InfluxDB will run in Docker Compose and will be accessible on our local host. The port should match the port exposed by InfluxDb, 2003. Last, we set as rootPathPrefix the word gatling, which will be the prefix of the metrics we expose. The rest of the properties are just for better tuning.
Gatling execution will not be part of the Docker Compose. After we spin up all the services through Docker Compose, we can use the console to run any Gatling scenario we want, simulating a real-life external client of the service.
2.4. InfluxDB
Setting up InfluxDB is less straightforward than the other tools. First, we need a base image of the version we’re targeting, then a configuration.conf file, and an ENTRYPOINT file with some extra container config for storing the data exported by Gatling.
The configuration we need is regarding Graphite. We need to enable the Graphite endpoint in our influxdb.conf file so that it is accessible for Gatling to publish its execution data:
[[graphite]]
  enabled = true
  database = "graphite"
  retention-policy = ""
  bind-address = ":2003"
  protocol = "tcp"
  consistency-level = "one"
  batch-size = 5000
  batch-pending = 10
  batch-timeout = "1s"
  separator = "."
  udp-read-buffer = 0
First, we set enabled = true and add some properties regarding the database, like retention policy, consistency level, and a few more, along with some connection properties, like the protocol, bind-address, and more. The important property here is the port we set as bind-address, so we can use it in Gatling, in the Graphite configuration.
The next step is to create the entrypoint.sh file that instantiates the influx database and creates the database, using the configuration file we created:
#!/usr/bin/env sh
if [ ! -f "/var/lib/influxdb/.init" ]; then
    exec influxd -config /etc/influxdb/influxdb.conf $@ &
    until wget -q "http://localhost:8086/ping" 2> /dev/null; do
        sleep 1
    done
    influx -host=localhost -port=8086 -execute="CREATE USER ${INFLUX_USER} WITH PASSWORD '${INFLUX_PASSWORD}' WITH ALL PRIVILEGES"
    influx -host=localhost -port=8086 -execute="CREATE DATABASE ${INFLUX_DB}"
    touch "/var/lib/influxdb/.init"
    kill -s TERM %1
fi
exec influxd $@
First, we execute influxd and point to the configuration file we’ve created. Then, we wait until the service is available, in the until loop. Last, we start the database.
After creating all prerequisites, the creation of the Dockerfile should be straightforward:
FROM influxdb:1.3.1-alpine
WORKDIR /app
COPY entrypoint.sh ./
RUN chmod u+x entrypoint.sh
COPY influxdb.conf /etc/influxdb/influxdb.conf
ENTRYPOINT ["/app/entrypoint.sh"]
First, we use the base image of the version of our choice, then we copy the files to the container and give the necessary access, and last, we set ENTRYPOINT as the entrypoint.sh file we created.
2.5. Grafana
Starting the Grafana service in the container is straightforward. We can just use one of the images Grafana offers. In our case, we’ll include some configuration files and dashboards in the image, too. This could be done manually after we start the service, but for a better experience and to keep the configuration and dashboards stored in VCS, for history and backups, we’ll go with creating the files beforehand.
First, we set the data sources in a yml file:
datasources:
  - name: Prometheus-docker
    type: prometheus
    isDefault: false
    access: proxy
    url: http://prometheus:9090
    basicAuth: false
    jsonData:
      graphiteVersion: "1.1"
      tlsAuth: false
      tlsAuthWithCACert: false
    version: 1
    editable: true
  - name: InfluxDB
    type: influxdb
    uid: P951FEA4DE68E13C5
    isDefault: false
    access: proxy
    url: http://influxdb:8086
    basicAuth: false
    jsonData:
      dbName: "graphite"
    version: 1
    editable: true
The first source is Prometheus, and the second is InfluxDB. The important configuration is the url, to be sure we correctly point to the two services running in our Docker Compose.
Then, we create a yml file to define the path from which Grafana can retrieve our stored dashboards:
providers:
  - name: 'dashboards'
    folder: ''
    type: file
    disableDeletion: false
    allowUiUpdates: true
    editable: true
    options:
      path: /etc/grafana/provisioning/dashboards
      foldersFromFilesStructure: true
Here, we need to set the path correctly. Then, we’ll include it in the Dockerfile to store our dashboards’ JSON files:
FROM grafana/grafana:10.2.2
COPY provisioning/ /etc/grafana/provisioning/
COPY dashboards/ /etc/grafana/provisioning/dashboards
EXPOSE 3000:3000
In the Dockerfile, we set the base image of the Grafana version we want to use. Then, we copy the configuration files from provisioning to /etc/grafana/provisioning/, where Grafana will be looking for the configuration and the dashboards’ JSON files we have in the dashboards folder to the path we set in the previous step, /etc/grafana/provisioning/dashboards. Last, we mention the port we want to expose for the service, 3000.
Note that, for our demonstration, we’ve created two dashboard files – application-metrics.json and gatling-metrics.json – in the dashboards folder, but they’re too long to be included in this article.
2.6. Docker Compose
After we’ve created all of the services, we bring everything together in Docker Compose:
services:
  influxdb:
    build: influxDb
    ports:
      - '8086:8086'
      - '2003:2003'
    environment:
      - INFLUX_USER=admin
      - INFLUX_PASSWORD=admin
      - INFLUX_DB=influx
  prometheus:
    build: prometheus
    depends_on:
      - service
    ports:
      - "9090:9090"
  grafana:
    build: grafana
    ports:
      - "3000:3000"
  service:
    build: .
    ports:
      - "8080:8080"
Docker Compose will start the four services – influxdb, prometheus, grafana, and service. Note that the names used here will serve as the hosts for the internal communication of those services.
3. Monitoring Gatling Tests
Now that we have our setup of the tools in place, we can start all of the monitoring services and the REST API server through Docker Compose. Then, we can run the performance tests we created in Gatling and access Grafana to monitor the performance.
3.1. Executing the Tests
The first step is to start all the services through Docker Compose from our terminal by running docker-compose up –build. When they are all up and healthy, we can execute the Gatling simulation with the terminal and Maven.
For example, for the second simulation, we need to execute mvn gatling:test -Dgatling.simulationClass=org.baeldung.FastEndpointSimulation:
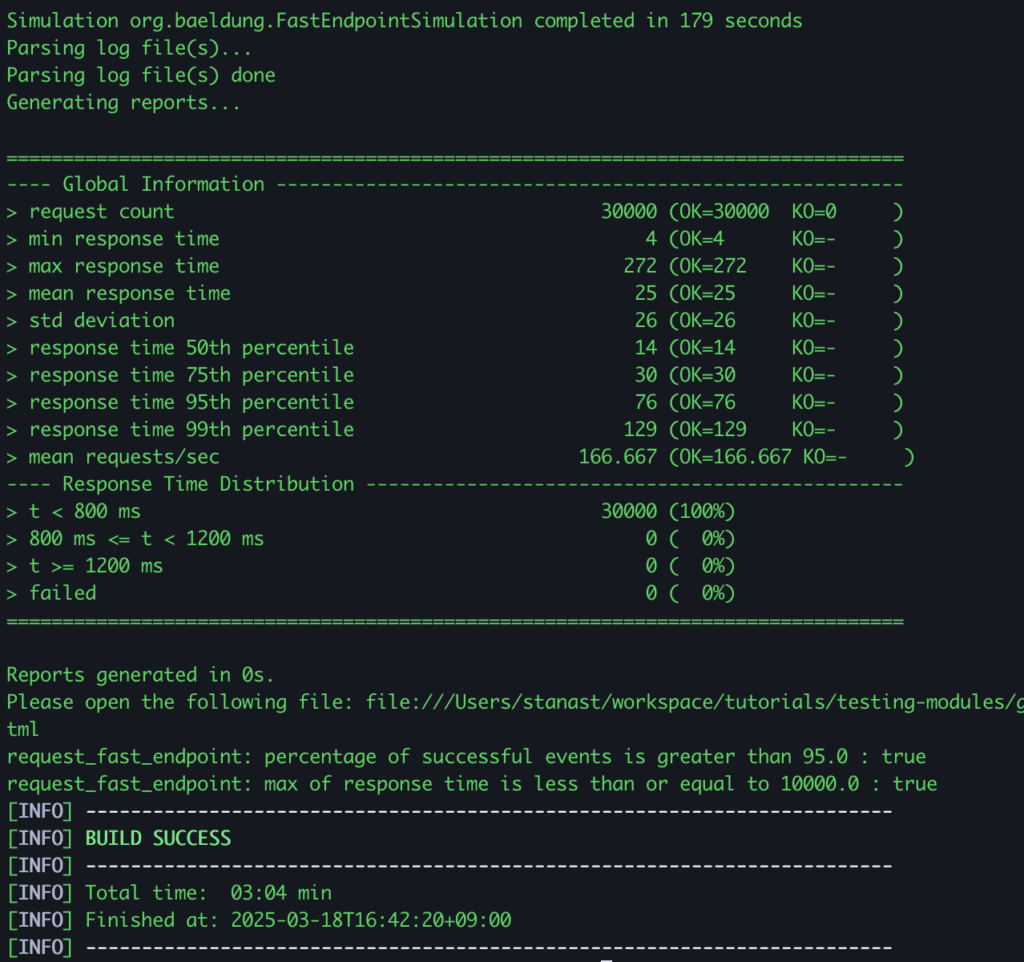
As we see in the results, our “simulation completed in 179 seconds” and all the assertions were met.
3.2. Monitoring with Grafana Dashboards
Now, let’s access Grafana to check the monitoring data we’ve collected. We can access Grafana at http://localhost:3000/ from our browser and log in using ‘admin’ in both username and password fields. There should be two existing dashboards, one for each of the two dashboard JSON files we included through the Dockerfile.
The first dashboard gives us a visualization of the application metrics:
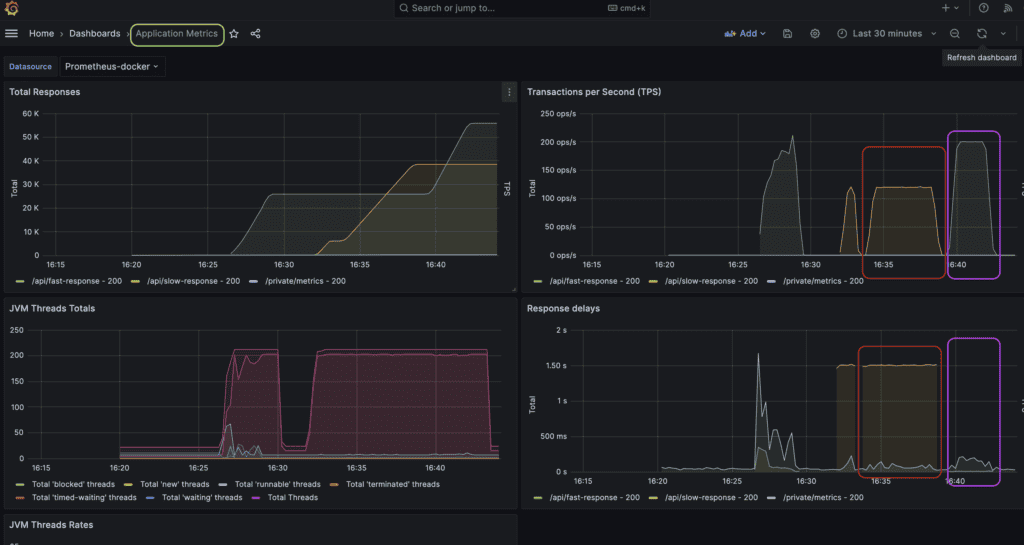
In the Transaction per Second (TPS) and Response delays views, we can observe that Gatling produced the expected load. The red circled metrics are for the slow endpoint performance test. It took 300s to be executed, the TPS was 120, and the response delays were around 1.5s.
The purple highlighted metrics are for the fast endpoint performance test. This simulation lasted for 180 seconds, with TPS at 200 and response delays being much less, since this endpoint replies immediately with a successful response.
The second dashboard is about Gatling metrics, which show the client’s perspective of response codes, delays, and more:
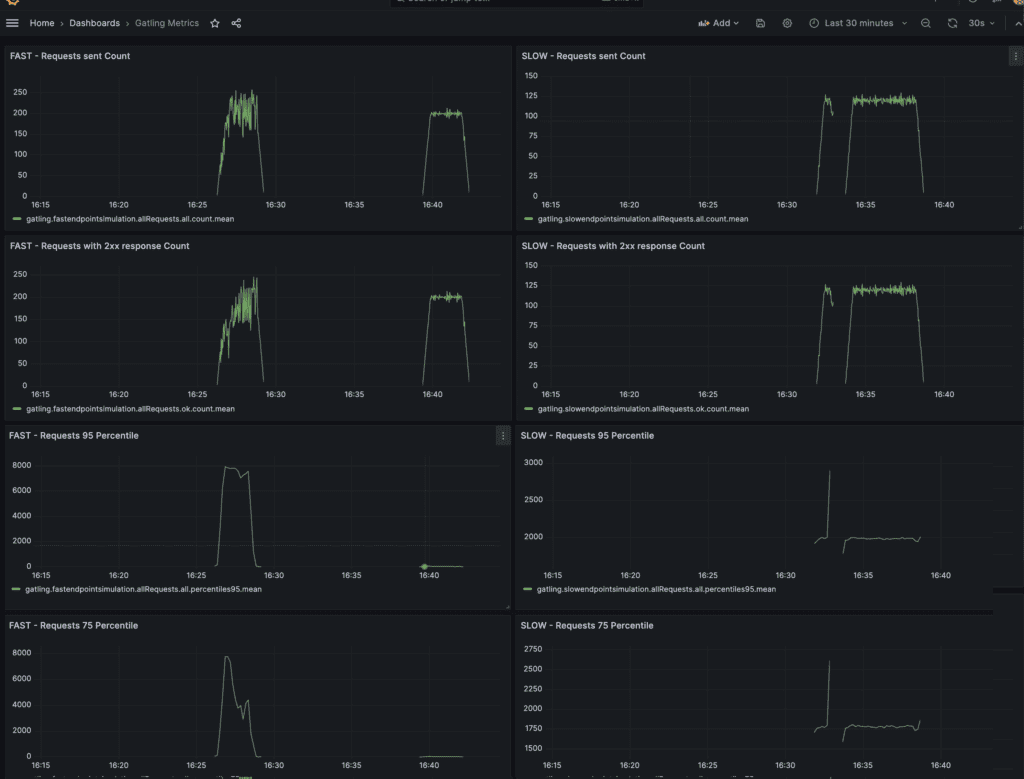
In this dashboard, we can see, on the left side, the metrics collected from Gatling for the fast endpoint test simulation, and on the right, the ones for the slow endpoint test simulation. We can verify that the traffic produced was as expected and that the response statuses and delays accurately correspond to what we saw in the application metrics dashboard.
3.3. Reading the Results
Now that we have everything in place, let’s tune our JVM. By reading the metrics, we can identify possible bugs and also try tuning the JVM in different ways to improve performance.
The existing dashboard has a view of the JVM Threads metrics. For example, we can see how many threads are utilized for each endpoint. Then, we can make observations, like whether the thread count when testing a specific endpoint is higher than expected. If so, this might mean we overuse threads in the implementation of this specific endpoint.
Another significant aspect of monitoring a JVM is Garbage Collection metrics. We should always include dashboards about GC frequencies, durations, and other factors. Then, we can try different Garbage Collections and configurations, rerun our performance tests, and find the best solution for our API.
4. Conclusion
In this article, we looked at how we can set up proper monitoring when executing performance tests with Gatling. We set up the tools needed to monitor both the REST API and Gatling, and we demonstrated some test executions. Last, we read the results by using Grafana dashboards and mentioned some metrics we need to focus on when we run performance tests, like those pertaining to JVM Threads and Garbage Collection.
As always, all the source code used in the examples can be found over on GitHub.
The post Gatling Tests Monitoring first appeared on Baeldung.


