
1. Overview
The quarkus-load-shedding extension provides a mechanism for intentionally rejecting requests under high-traffic conditions to prevent system overload within an application or service. The library also exposes key configuration properties that help customize how load shedding is handled.
In this tutorial, we’ll look at how we can incorporate this extension into our Quarkus application and customize its configurations to meet our specific needs.
2. Setup
To demonstrate the key features of the quarkus-load-shedding extension, we’ll use two web resources exposed as REST endpoints: FibonacciResource and FactorialResource. Each of these, when called, introduces a random response delay of one to 15 seconds before returning a result.
Let’s start by adding the extension as a dependency to our Quarkus project:
<dependency>
    <groupId>io.quarkus</groupId>
    <artifactId>quarkus-load-shedding</artifactId>
</dependency>
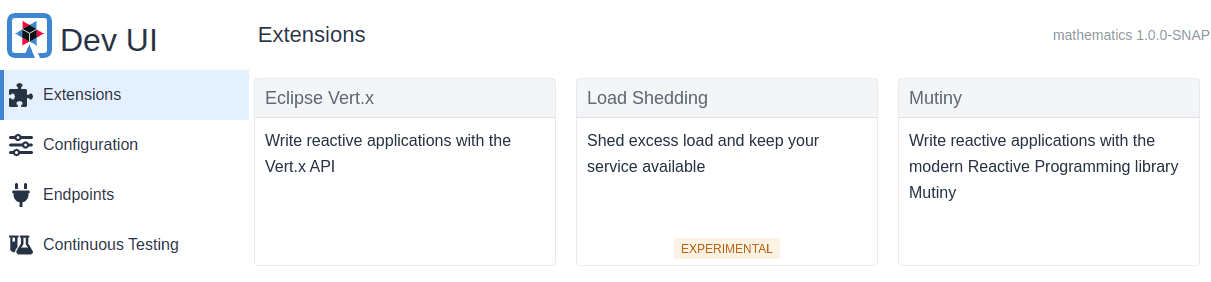
When we start the app in dev mode, we should be able to see the extension on the Dev UI:
./mvnw quarkus:devAs of the time of writing, this extension is still in experimental status:
3. Default Load Shedding
Once the extension is added, it’s enabled by default. It’ll start shedding requests using the default configuration.
Let’s adjust this configuration to make it more restrictive by editing the application.properties file:
quarkus.load-shedding.enabled=true
quarkus.load-shedding.max-limit=10
quarkus.load-shedding.initial-limit=5
This configuration sets both the initial and maximum limits for allowed concurrent requests. The max-limit sets the boundary for concurrent requests, and the initial-limit is primarily used to compute the acceptable queue size.
Now, let’s test our configuration by calling the two endpoints with JMeter. In JMeter, we set up 7 user threads to run twice with a ramp-up period of 5 seconds:

Running this test plan gives us the results below, which show that the HTTP 503 error rate is evenly split between the two endpoints.
| Label | # Samples | Average | Min | Max | Std. Dev. | Error % |
|---|---|---|---|---|---|---|
| Fibonacci HTTP Request | 14 | 5735 | 2 | 12613 | 4517.63 | 28.571% |
| Factorial HTTP Request | 14 | 5195 | 1 | 11470 | 4133.69 | 28.571% |
| TOTAL | 28 | 5465 | 1 | 12613 | 4338.33 | 28.571% |
The quarkus-load-shedding extension rejected requests indiscriminately, according to the configuration in application.properties.
4. Custom Load Shedding
The quarkus-load-shedding extension exposes a few configurations that enable us to customize the load-shedding behavior. One such feature is the ability to prioritize which requests should be shed when the system is under heavy load. Let’s take a look at this in the next subsection.
4.1. Request Prioritisation
First, let’s enable the priority setting in our application.properties file:
# ...
quarkus.load-shedding.priority.enabled=true
Now, let’s provide an implementation of the RequestPrioritizer to specify our request priority:
@Provider
public class LoadRequestPrioritizer implements RequestPrioritizer<HttpServerRequestWrapper> {
    @Override
    public boolean appliesTo(Object request) {
        return request instanceof HttpServerRequestWrapper;
    }
    //...
}
Our LoadRequestPrioritizer class is annotated with @Provider as a CDI bean so that the runtime can automatically discover it. We also specified that it should only process HttpServerRequestWrapper type requests.
Next, we assign a priority to a specific target endpoint:
@Provider
public class LoadRequestPrioritizer implements RequestPrioritizer<HttpServerRequestWrapper> {
    //...
    @Override
    public RequestPriority priority(HttpServerRequestWrapper request) {
        String requestPath = request.path();
        if (requestPath.contains("fibonacci")) {
            return RequestPriority.CRITICAL;
        } else {
            return RequestPriority.NORMAL;
        }
    }
}
Therefore, the /fibonacci endpoint will have a higher priority than the other endpoints, which means requests to that endpoint are less likely to be rejected than the others.
4.2. Trigger Load Detection
Since the quarkus-load-shedding extension applies priority load shedding only when it detects the system is under stress, next, let’s simulate a CPU load:
@Path("/fibonacci")
public class FibonacciResource {
    //...
    @PostConstruct
    public void startLoad() {
        for (int i = 0; i < Runtime.getRuntime().availableProcessors(); i++) {
            new Thread(() -> {
                while (true) {
                    Math.pow(Math.random(), Math.random());
                }
            }).start();
        }
    }
}
When first called, the @PostConstruct of the FibonacciResource triggers a CPU-intensive task to ensure the CPU remains under load during the test. After restarting the application, let’s trigger an initial request to the /fibonacci endpoint:
curl -X GET http://localhost:8080/api/fibonacci?iterations=9Next, we execute the JMeter test plan again with the same values, producing the results below:
| Label | # Samples | Average | Min | Max | Std. Dev. | Error % |
|---|---|---|---|---|---|---|
| Fibonacci HTTP Request | 14 | 5848 | 9 | 13355 | 4280.47 | 14.286% |
| Factorial HTTP Request | 14 | 6915 | 10 | 14819 | 5905.41 | 28.571% |
| TOTAL | 28 | 6381 | 9 | 14819 | 5184.86 | 21.429% |
As shown in the table, the rejection rate was lower on the /fibonacci endpoint due to its higher priority.
4.3. System Probe Rate
The probeFactor config influences how often the extension probes or checks for fluctuations in the system’s request-handling capacity.
By default, the probeFactor is set to 30. To compare the effects of this setting, let’s first run a JMeter test on the FibonacciResource only, with 11 user threads:

Let’s look at the results after running the JMeter test plan:
| Label | # Samples | Average | Min | Max | Std. Dev. | Error % |
|---|---|---|---|---|---|---|
| Fibonacci HTTP Request | 33 | 8236 | 3 | 14484 | 4048.21 | 9.091% |
| TOTAL | 33 | 8236 | 3 | 14484 | 4048.21 | 9.091% |
As expected, only three requests (i.e., 33 samples x 9.091% error rate) were rejected because we configured the maximum allowed concurrent requests as 10 in our application.properties file.
Let’s now increase the probeFactor from its default value of 30 in the application.properties file:
quarkus.load-shedding.probe-factor=70Then, let’s rerun our JMeter test using the same setup as before and examine the results:
| Label | # Samples | Average | Min | Max | Std. Dev. | Error % |
|---|---|---|---|---|---|---|
| Fibonacci HTTP Request | 33 | 6515 | 11 | 13110 | 3850.50 | 6.061% |
| TOTAL | 33 | 6515 | 11 | 13110 | 3850.50 | 6.061% |
This time, only two requests were rejected. Setting a high probeFactor makes the system less sensitive to fluctuations in load.
4.4. Queue Management
The alphaFactor and betaFactor configurations control how the limit is incremented and decremented (from the initial to the maximum limit) based on the observed request queue size. To see their effect, let’s add them to our application.properties file:
quarkus.load-shedding.alpha-factor=1
quarkus.load-shedding.beta-factor=5
Rerunning our previous JMeter test with 11 user threads from the previous section, we get the following result:
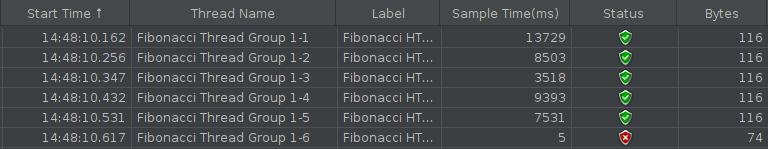 From the result, we note that the limit allocation was gradual, which led to the rejection of the sixth request, even though the maximum limit hadn’t been reached yet.
5. Conclusion
In this article, we saw how we can incorporate the quarkus-load-shedding extension into our Quarkus application so that our system can respond effectively under load. We also learned how to customize the extension to meet our needs by adjusting its configuration properties and gained a deeper understanding of what each one means.
As always, the code is available over on GitHub.
The post Load Shedding in Quarkus first appeared on Baeldung.


