1. Overview
JMeter is a very popular solution for testing the performance of JVM applications. One problem we often face in JMeter is how to control the amount of requests we make in a given time. This is especially critical at the warm-up phase when the application has just started up and spun up threads.
JMeter test plans have a property, called ramp-up period, that offers a way to configure the frequency of users making requests to the system under test. Furthermore, we can use this property to tune the number of requests per second.
In this tutorial, we’ll briefly examine some main concepts of JMeter and we’ll focus on understanding the use of ramp-up in JMeter. Then, we’ll try to get a clear understanding of it and learn how to properly compute/configure it.
2. Concepts of JMeter
JMeter is an open-source software, written in Java, used for performance testing JVM applications. Originally, it was created to test the performance of web applications, but nowadays it supports other types, such as FTP, JDBC, Java Objects, and more.
Some of the key features of JMeter include:
- command line mode, which is advised for more accurate load testing
- support of distributed performance testing
- rich reporting, including dashboard reports
- simultaneous multi-threaded sampling using thread groups
Running a load test with JMeter involves three main phases. First, we need to create a test plan, which has the configuration of the scenario we want to simulate. For example, the test execution period, operations per second, concurrent operations, etc. Then, we execute the test plan and last, we analyze the results.
2.1. Thread Group of a Test Plan
In order to understand ramp-up in JMeter, we need to first understand the thread groups of a test plan. A thread group controls the number of threads of a test plan and its main elements are:
- number of threads which is the number of different users we want to execute the current test plan
- ramp-up period, in seconds, is the time JMeter will take to get all users up and running
- the loop count is the number of repetitions. In other words, it sets the number of times a user (thread) is executing the current test plan

3. Ramp-up in JMeter
As mentioned earlier, ramp-up in JMeter is the property that configures the period JMeter needs to spin up all threads. This also implies what the delay between starting each thread is. For example, if we have two threads and a ramp-up period of one second, then JMeter needs one second to start all users, and each user starts with a delay of approximately half a second (1 second / 2 threads = 0.5 seconds).
If we set the value to zero seconds, then JMeter immediately starts all of our users together.
One thing to note is that by number of threads, we mean users. So, using ramp-up in JMeter we tune the users per second, which is different from the operations per second. The latter is a key concept in performance testing, one we target when setting up a performance testing scenario. The ramp-up period, in combination with some other properties, also helps us to set the operations per second value.
3.1. Using Ramp-up in JMeter to Configure Users Per Second
In the following examples, we’ll be executing the tests against a Spring Boot application. The endpoint we’re testing is a UUID generator. It just creates a UUID and returns the response:
@RestController
public class RetrieveUuidController {
    @GetMapping("/api/uuid")
    public Response uuid() {
        return new Response(format("Test message... %s.", UUID.randomUUID()));
    }
}
Now, let’s say we want to test our service with 30 users per second. We can achieve this easily, by setting the number of threads to 30 and the ramp-up period to 1. But this isn’t giving much value as a performance test so let’s say we want 30 users per second, for one minute:

We set the total number of threads to 1800, which gives us 30 users per second over a minute (30 users per second * 60 seconds = 1800 users). Because each user is executing the test plan once (loop count is set to 1), the throughput, or operations per second, is also 30 operations per second, as shown in the summary report:

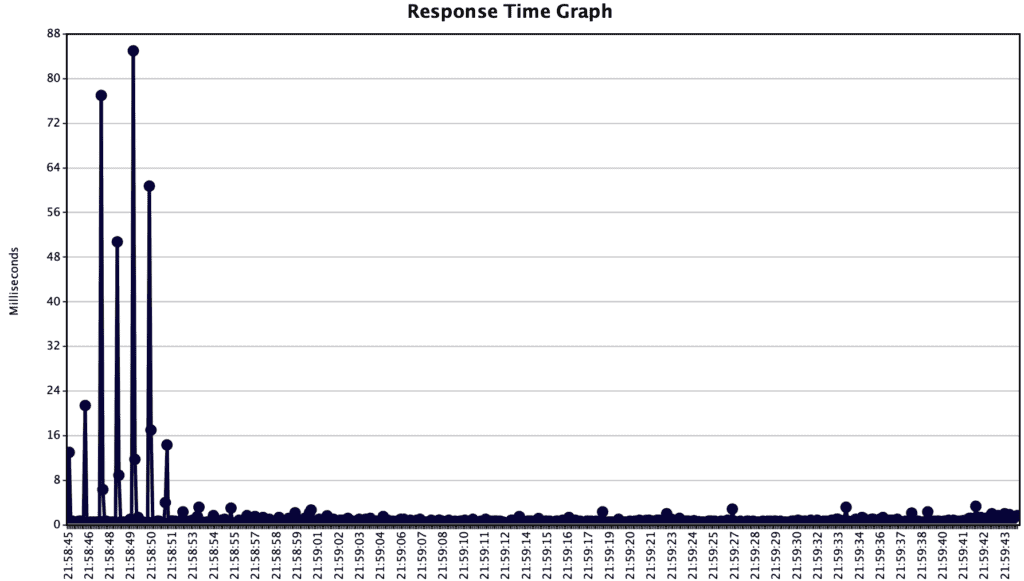
Further, we can see from the JMeter graphs, that the test was indeed executed for 1 minute (~21:58:42 to 21:59:42):

3.2. Using Ramp-up in JMeter to Configure Requests Per Second
In the following examples, we’ll be using the same endpoint of the Spring Boot application we presented in the previous paragraph.
In performance testing, we care more about the system throughput, than the number of users during some period. This is because the same user can make multiple requests in a given time, such as clicking the ‘Add to cart’ button many times while shopping. Ramp-up in JMeter can be used, in combination with loop count, to configure the throughput we want to achieve, independently of the number of users.
Let’s consider a scenario where we want to test our service with 60 operations per second, for one minute. We can achieve this in two ways:
- We can set the total number of threads to the targeted ops * total seconds of the execution and the loop count to 1. This is the same approach as earlier and this way we have a different user for each operation.
- We set the total number of threads to targeted ops * total seconds of execution / loop count and set some loop count so that each user does more than one operation.
Let’s put some numbers to it. In the first case, similar to the previous examples, we set the total number of threads to 3600, which gives us 60 users per second over a minute (60 operations per second * 60 seconds = 3600 users):

This gives us a throughput of ~60 operations per second, as shown in the summary report:

From this graph, we also see the total samples (requests to our endpoint) that are the number we expected, 3600. The total execution time (~21:58:42 to 21:59:42) and response delay can be seen in the response time graph:

In the second case, we target 60 operations per second for one minute, but we want each user to be doing two operations on the system. So, we set the total number of threads to 1800, ramp-up to 60 seconds, and loop count to 2, (60 operations per second * 60 seconds / 2 loop count = 1800 users):

We can see from the summary result that the total samples are again 3600, as expected. The throughput is also the expected one of about 60 per second:

Last, we verify that the execution time was one minute (~21:58:45 to 21:59:45), in the response time graph:

4. Conclusion
In this article, we looked at the property of ramp-up in JMeter. We learned what ramp-up period does and how to use it to tune two main aspects of performance testing, users per second and requests per second. Finally, we used a REST service to demonstrate how to use ramp-up in JMeter and presented the results of some test executions.
As always, all the source code is available over on GitHub.


